
Back to Main Research page
Project 1A. Imaging Fluorescence Correlation Spectroscopy (ImFCS) to measure precise diffusion coefficients and reveal changes in membrane organization occurring with antigen-activation of IgE-FcεRI
 Imaging Fluorescence Correlation Spectroscopy. Measurements and analysis as described in Bag et al Mol Bio Cell, 20201
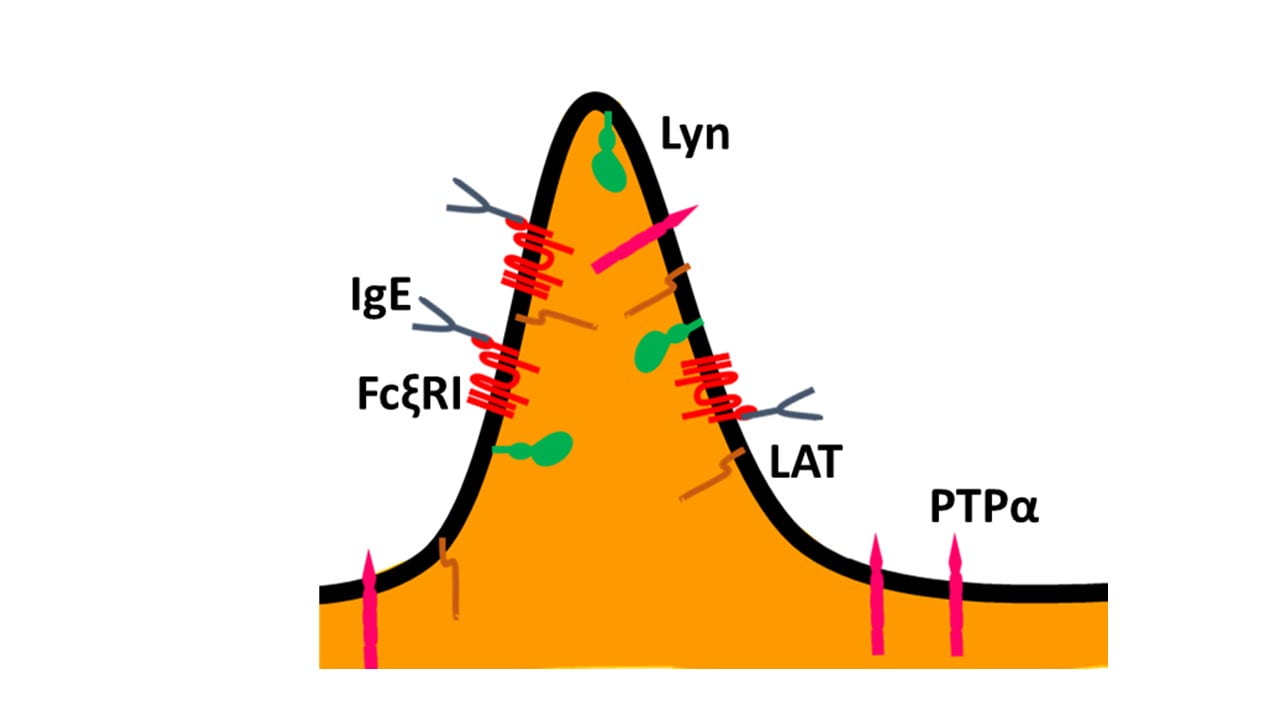
Our experimental model system is stimulation, by extracellular antigen, of transmembrane (TM) receptor, FcεRI, for Immunoglobulin E (IgE) in RBL mast cells. Our work over many years led us to formulate a working model on the role of plasma membrane heterogeneity in TM signaling that is initiated by antigen-mediated redistribution of IgE-FcεRI complex, tyrosine kinase (Lyn) lipid-anchored to the membrane inner leaflet, and TM tyrosine phosphatase. In the resting steady-state, phosphorylation and dephosphorylation of FcεRI by kinase and phosphatase respectively are counter-balanced such that the net phosphorylation of FcεRI remains below a functional threshold. Crosslinking of IgE-FcεRI complexes by extracellular, multivalent antigen leads to formation of receptor nanoclusters, which stabilize a proximal liquid-ordered (Lo)-like environment. Lipid anchored kinase, Lyn, preferably partitions into the Lo-like regions by lipid-based interactions while TM phosphatase is excluded from these regions. Such spatial filtering in the stimulated steady-state facilitates productive coupling between kinase and nano-clustered receptors. This shifts the balance to phosphorylated FcεRI causing assembly of other signaling components in a cascade to downstream cellular responses.
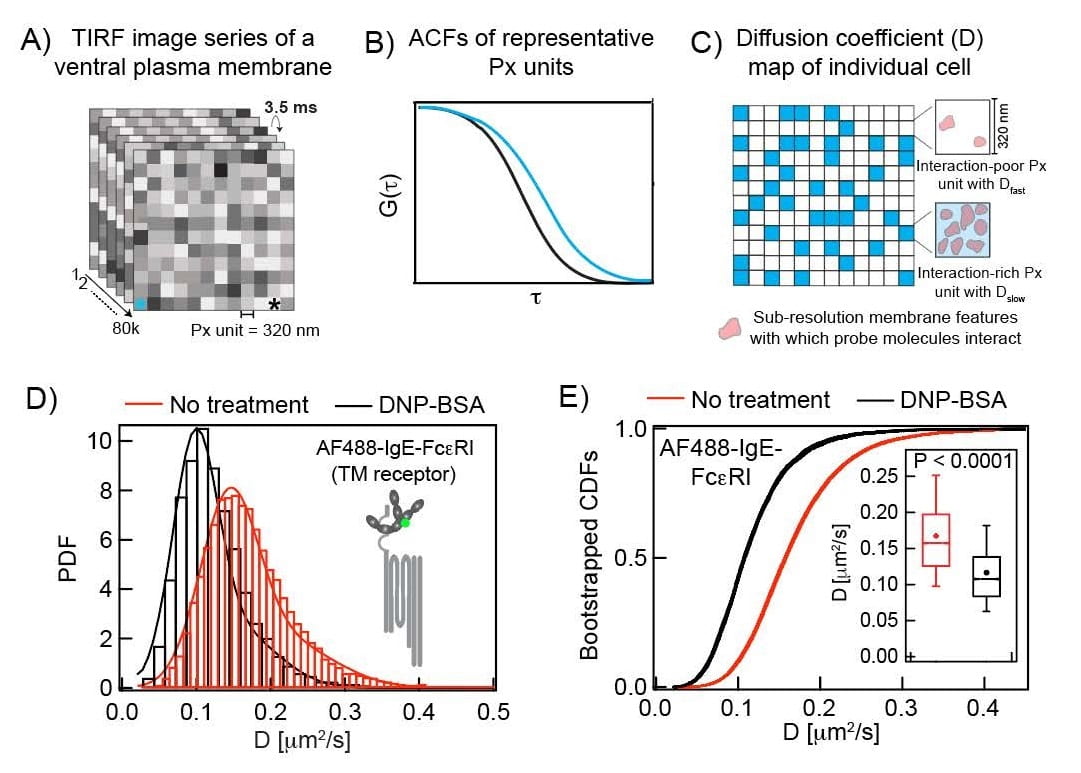
For rigorous evaluation of this model, we are developing methods to directly compare the dynamics of signaling components in resting and antigen-stimulated steady-states. A precise and robust comparison is necessary because of the weak and dynamic nature of these interactions and subtle differences in membrane organization in the resting and stimulated states. These subtle changes are difficult to evaluate by conventional and generally low-throughput techniques. We employ a variety of biophysical and molecular biology tools to systematically address the lipid-based, protein-based, and other physical interactions involved in FcεRI-mediated TM signaling. We use Total Internal Reflection Fluorescence Microscopy (TIRFM)-based Imaging Fluorescence Correlation Spectroscopy (ImFCS; see figure above) and Fluorescence Recovery After Photobleaching (FRAP) to evaluate diffusion properties of membrane components with distinctive structural features in live cells.1-3 In parallel, we use TIRFM-imaging of single cells to refine the detergent-resistance membrane (DRM) analysis, which was used previously in bulk assays to evaluate lipid-phase partitioning properties of membrane components.2,4 We develop novel statistical analysis platforms of ImFCS, FRAP, and DRM data to evaluate subtle differences in the corresponding biophysical parameters that these techniques measure. Our observations using these methods show that: a) RBL plasma membrane steady-state is relatively more Lo-like after stimulation by antigen-crosslinking of IgE-FcεRI, b) TM phosphatases are excluded from regions of crosslinked FcεRI due to lipid and steric constraints, c) lipid-based partitioning of Lyn to the Lo-like regions is essential for its subsequent protein-based binding to super-threshold phosphorylated FcεRI, leading to downstream signaling. Our current model is shown in figure below2.
 Antigen-mediated crosslinking of IgE-FcεRI stabilizes phase-like separation in the plasma membranes of mast cells. This stimulated distinction of ordered (Lo) and disordered (Ld) regions results in dynamic lipid-based and protein-based interactions that redistribute signaling components and leads to supra-threshold phosphorylation of receptors by Lyn kinase. Details described in Bag et al PNAS, 20212
To extend our insight into the interactions of membrane components as they occur during the process of IgE-FcεR1 activation by antigen, we are developing a novel analysis platform to evaluate time-dependent changes of probe diffusion. This is done by overlapped segmentation (Boxcar) of the time-lapse TIRFM movie recorded in an ImFCS measurement. Our typical ImFCS raw data consists of 80,000 frames of 8×8 μm2 sample region recorded at 3.5 ms/frame temporal resolution (i.e., 280 sec total data acquisition time) and 320 nm spatial resolution. The software-based ImFCS data analysis from this entire data set (280 sec long movie) is traditionally used to create the maps of diffusion coefficient with 320 nm resolution (see figure above). Our standard measurements yield a diffusion map in every 280 sec at the best. We took advantage of Boxcar segmentation to gain information at shorter time points.
In our Boxcar analysis, we take the first 40,000 frames (1-40000 images) from the entire movie and perform ImFCS analysis; thereby creating an initial diffusion map (D map_1). We then perform ImFCS analysis on the image range between 10,001-50,000 frames to create the next diffusion map in the sequence (D map_2). The time difference between these two D maps is 35 sec (i.e., 3.5 ms × 10,000). Repeating this same analysis on each 40,000 image segments which are shifted by 10, 000 frames yields diffusion maps every 35 sec. In this manner, we can monitor changes of diffusion in every 35 sec in multiple individual cells. Correspondingly we determine timecourses for diffusion coefficients of selected probes as they change during activation, reflecting changes in probe interactions. We also determine coefficient of variation for these diffusion coefficients, a measure of their dispersion corresponding to heterogeneity of probe interactions. Currently, we are applying this method to determine the timecourse of stimulated diffusion changes of Lyn kinase in RBL mast cells after IgE-FcεR1 activation by antigen.
- Bag, N., D.A. Holowka, B.A. Baird: Imaging FCS Delineates Subtle Heterogeneity in Plasma Membranes of Resting Mast Cells. Molecular Biology of the Cell 31(7): 709-723 (2020). (Special Issue on Quantitative Cell Biology)
- Bag*, N., A. Wagenknecht-Wiesner, A. Lee, S.M. Shi, D.A. Holowka, B.A. Baird*: Lipid-based and protein-based interactions synergize transmembrane signaling stimulated by antigen-clustering of IgE receptors. Proceedings of the National Academy of Sciences, USA 118(35): e2026583118 (2021).
- Bag, N., E. London, D.A. Holowka, B.A. Baird: Transbilayer Coupling of Lipids in Cells Investigated by Imaging Fluorescence Correlation Spectroscopy. J. Phys. Chem. B 126(12): 2325-2336 (2022).
- Batrouni*, A.G., N. Bag*#, H. Phan, B.A. Baird, J.M. Baskin#: A palmitoylation code controls PI4KIIIa complex formation and PI(4,5)P2 homeostasis at the plasma membrane. J. Cell Science 135(5): jcs259365-1-17 (2022).
Project 1B. Microvillar Cartography (MC) to Investigate Control of IgE-FcεRI Signaling by Membrane Topography
IgE-FcεR1 and co-stimulatory molecules reside on microvilli on resting RBL mast cells. Initial results show that, similar to T cells, this immunoreceptor and its activating tyrosine kinase Lyn selectively co-reside on microvilli prior to activation by multivalent antigen.
The surface of mammalian cells is not flat or smooth. The role of membrane topography, particularly membrane curvature and membrane protrusions, in controlling cellular function remains substantially under-appreciated. To understand the role of membrane topography in cellular physiology, one needs to understand the distribution of membrane proteins with respect to three-dimensional membrane topography. However, this is a challenging task, due to the fact that the width of the membrane curvatures and protrusions generally lies within ~100 nm, which is well below the diffraction limit of the optical microscope. Recently, Haran and co-workers designed a super-resolution microscopy-based methodology called ‘Microvillar Cartography’ (MC) to study the cell surface topography and localization of membrane proteins with respect to the membrane topography in fixed samples.1-3 Using this technique, they showed that microvilli, the finger-like actin dependent projections of T cells, are key signaling hubs for T cell receptor (TCR)-mediated responses to antigen in cellular immune responses: To facilitate initial antigen sensing the TCR complex and its proximal signaling molecules and adaptors are preassembled on microvilli prior to activation, which then modulates membrane linkages with filamentous actin mediated by ezrin-radixin-moesin (ERM) proteins.1-3
MC is a state-of-the-art technique for determining at nanometer resolution the location of membrane molecules with respect to three-dimensional (3D) surface structures, using a synergistic combination of two types of fluorescence microscopy: variable-angle total internal reflection microscopy (VA-TIRFM) resolves the 3D topography of the cell, and stochastic localization nanoscopy (SLN) determines the position of molecules with respect to this topography. 1-3
We have adopted the MC strategy to investigate the role of membrane topography in initiating and controlling mast cell signaling mediated by the receptor for IgE (IgE-FcεRI) in RBL mast cells. Mast cells are responsible for allergic immune responses and, like T cells, possess microvilli-dominated membrane topography. However, mast cells are typically activated by soluble antigens rather than by the surfaces of antigen-presenting cells in the case of T cells. Moreover, mast cells typically do not form immunological synapses with other cells like T cells. Our initial results indicate that IgE-FcεRI and co-signaling molecules responsible for the activation of mast cells are pre-organized on the microvilli of mast cells. Activation of mast cells by soluble antigen does not lead to the collapse of microvillar topography, but rather multiple microvilli seem to merge into ridge-like structures. We are also investigating the synergy between lipid phase-like separation and membrane topography of mast cells and the role of lipids in controlling the localization of membrane proteins to the microvillar structures.
- Y. Jung, I. Riven, S. W. Feigelson, E. Kartvelishvily, K. Tohya, M. Miyasaka, R. Alon and G. Haran, Proc Natl Acad Sci U S A, 2016, 113, E5916-E5924
- S. Ghosh, V. Di Bartolo, L. Tubul, E. Shimoni, E. Kartvelishvily, T. Dadosh, S. W. Feigelson, R. Alon, A. Alcover and G. Haran, Cell Rep, 2020, 30, 3434-3447 e3436.
- S. Ghosh, S. Feigelson, A. Montresor, E. Shimoni, F. Roncato, D. Legler, C. Laudanna, G. Haran, R. Alon. Biophysical Journal, 2021, 120, 4002-4012.